
Cheshire East Council Open Data
Find, preview and query the council's published data: spending over £500, purchase cards, contracts, air quality, wards and parishes, brownfield land and the census.
- 177
- Datasets
- 57
- Tables to explore
- 397,263
- Rows of data
What’s at my postcode?
Your ward and parish, whether you’re in an Air Quality Management Area, how your neighbourhood ranks on deprivation, and the nearest air quality monitor, community centre and brownfield sites.
Data story
Where does Cheshire East Council’s money go?
The council publishes its payments over £500 as one dataset per financial year, each with slightly different columns. We joined them into one table: £2777.9m paid to 5,087 suppliers in the financial years from 2019/20 to 2025/26.
Read the storyPayments over £500, by financial year
Popular datasets
Open any dataset to preview it as a table, query it with SQL and download it in the format you need.
 Table
Spending & Procurement
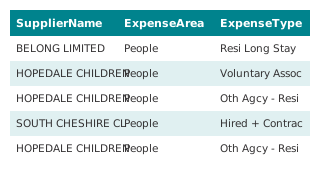
Expenditure exceeding 500 GBP, all years (combined)
Every yearly "Expenditure exceeding 500 GBP" dataset the council publishes on its Hub, 2019/20 to 2026/27, joined into one table by this demo: 8 years, 317,295 payment lines over £500. Column names and date formats differ between years; her
 Table
Spending & Procurement
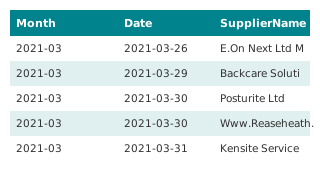
Purchase Card Spend, all years (combined)
Every yearly "Purchase Card Spend" dataset the council publishes on its Hub, 2021/22 to 2026/27, joined into one table by this demo: 6 years, 66,781 purchase card transactions. Column names and date formats differ between years; here they a
 Map
Air Quality & Environment
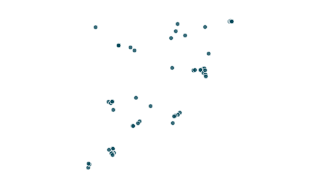
NO2 Diffusion tube data 2026 (Air Quality)
Monthly and annual average NO2 mean concentrations (µg/m3) from diffusion tubes across Cheshire East. NOTE - a figure of zero (0) indicates that there is no data for that month. All raw data is subject to Defra approved bias corrections and
 Map
Air Quality & Environment
Air Quality Management Areas (AQMAs)
Details on the air quality management areas that have been declared. All the areas (with one exception) are declared on the basis of being likely to breach the annual mean concentration of nitrogen dioxide, which is set as an Air Quality St
 Map
Boundaries
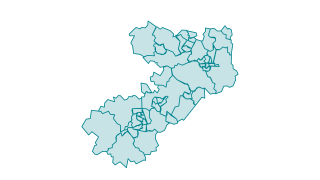
Wards in Cheshire East
Cheshire East is broken down in to 52 electoral wards. The current wards were setup in 2011 by the Local Government Boundary Commission for England. The Commission carried out an electoral review of Cheshire East between February 2009 - Jan
 Table
Planning & Land
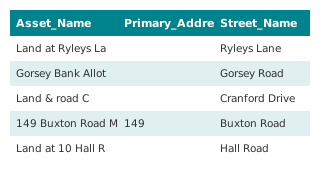
Local Land and Building Assets - Table View 2026
Details of land and building assets owned by Cheshire East Council Feb 2026 that meet the requirements and definitions under the Local Government Transparency Code 2015. This information is updated on an annual basis. A map of the data by W
Browse by category
Every dataset on the council's Hub, grouped by topic.
Recently updated
 Table
Business Rates & Council Tax
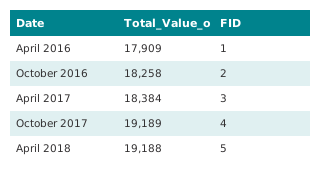
Business Rates - Credits written on
This dataset details the combined amount of credits written. We update this dataset quarterly. When someone no longer liable for business rates leaves an account in credit, we normally refund the credit back to them. But if we don't know wh
 Table
Business Rates & Council Tax
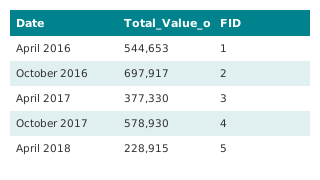
Business Rates - Accounts in Credit
This dataset details the combined amount of credits held on Business Rates accounts. We update this dataset quarterly. Accounts can be in credit for a number of reasons, including following a revaluation that decreases the rateable value. W
 Table
Spending & Procurement
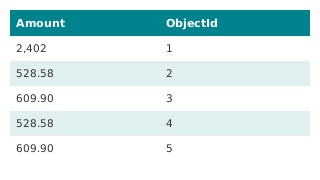
Expenditure exceeding 500 GBP (2026/27)
This dataset details each individual item of expenditure that exceeds £500 for the financial year 2025/26, as required by the Local Government Transparency Code 2015. This includes items of expenditure consistent with Local Government Assoc
Air Quality & Environment
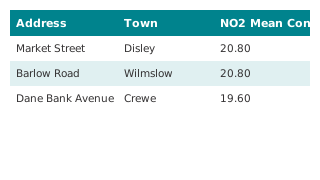
Diffusion Tubes (NO2) Data for Cheshire East 2026
Monthly and annual average NO2 mean concentrations (µg/m3) from diffusion tubes across Cheshire East. NOTE - a figure of zero (0) indicates that there is no data for that month. All raw data is subject to Defra approved bias corrections and
 Table
Air Quality & Environment
Analyser Air Quality Quarterly Data
 Map
Air Quality & Environment
Analyser Air Quality Quarterly Data
Data provided by the environment team. A valueof 0 indicates the data has not yet been provided for that timeframe. All data is to be treated as provisional until the final ratified annual averages are determined. The annual average objecti
Using the data
Free to reuse
Most of the council’s datasets are published under the Open Government Licence v3.0; each dataset page says which licence applies. Spending and contracts data is published under the Local Government Transparency Code.
Find and use a dataset
Search by name or browse by category. Tables open in a sortable, filterable preview you can query with SQL, map layers open on a map, and everything downloads as CSV or Parquet. Documents and the council’s interactive maps open on its Hub.
Missing something?
Ask the council’s transparency team at transparency@cheshireeast.gov.uk, or see its open data and transparency page.
More from the council
Other transparency information the council publishes outside its Hub.
- Open data and transparency
The council’s transparency page: what it publishes and where.
- Cheshire East Open Data (ArcGIS Hub)
The council’s current Hub, with its dashboards and web maps.
Your ArcGIS Hub stays the source
Nothing changes for the council’s data team: layers and files keep being published in ArcGIS. This site reads them, tidies them (dates, amounts, column names) and can refresh on a schedule. Residents get search across every dataset, tables and maps that load instantly, yearly tables joined into one, a postcode lookup, and queries that run in the browser.